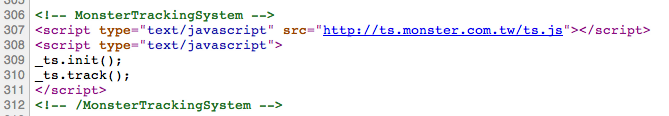
… like google analytics… Simply embbed the tracking code into web pages :
Every hour & Every day the cron job will process statistics …
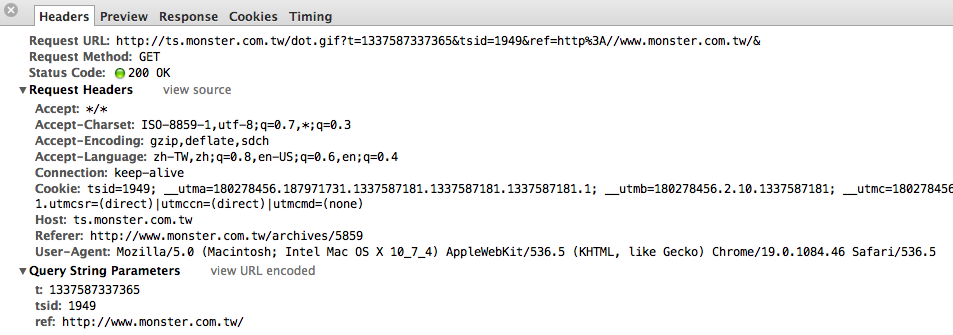
Sample tracking code : http://ts.monster.com.tw/
// ——————-
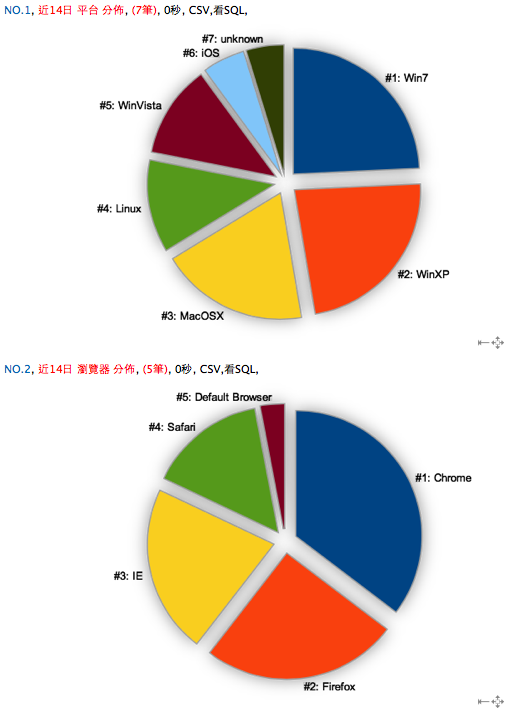
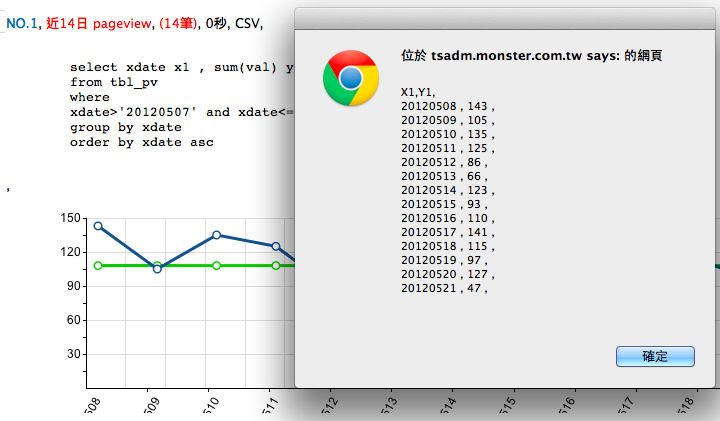
And this is the statistics report ….
This statistics report screen shot:
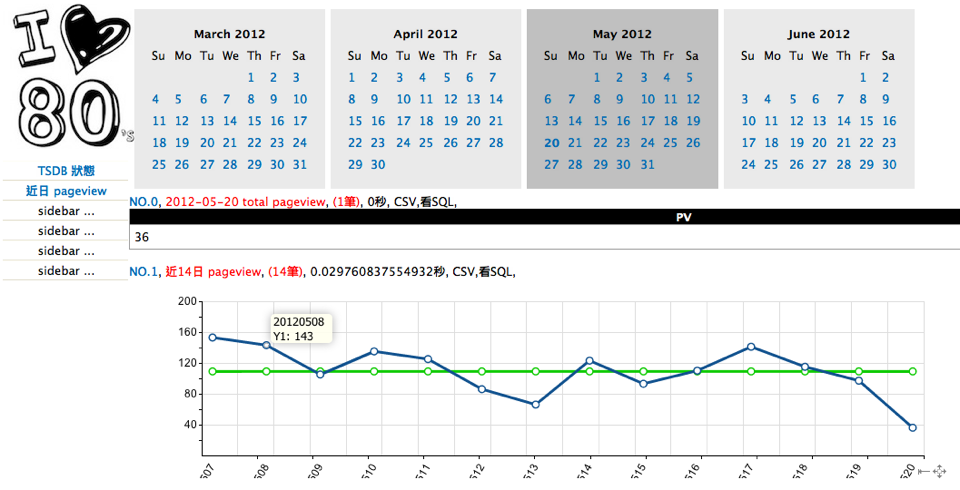
This is the SQL that I query , get the stat. data , I’m use MVC model , “V”iew program get these data call the RGRAPH javascript framework to draw the graph. (current support line / pie / bar / hbar graph )
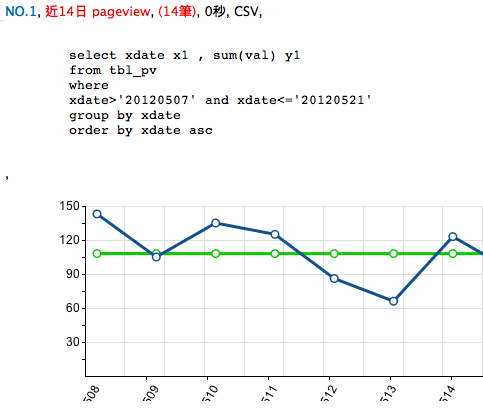
Or you can press “CSV” to get the text version data.
.
.
.
About cookies :

// —-
2012.0522 新增 平台 / 瀏覽器 分佈統計